Frequently Asked Questions
How can I insert markers for my MRI?
In PyLocator, markers are used to tag locations in 3d space. They are visualized using spheres and circles. The main use case is the localisation of EEG electrodes. These can be either surface electrodes or implanted ones.
Basically, you have three options to insert a new marker.
In the slice widgets
Especially when you are marking locations inside the brain, you’ll want to use the slice widgets for marking.
- Move the slice to the desired position so you can see the point you want to mark (target)
- Simply hover the mouse cursor over the target
- Hit the key i on the keyboard
Thats all. A blue circle will pop up, and in the 3d render windows above, a shpere will appear.
In the marker list
When you know the exact coordinates of your target you can insert a new marker by entering these coordinates directly. Use the list of markers to do so
- In the toolbar of the list of markers, hit the “Add” button
- In the dialog, enter the coordinates
- Press the “Ok”-button to confirm
Now the new marker will be inserted at the desired position.
On an iso-surface
In certain situations your target might be easier to identify on a reconstructed iso-surface (see below), e.g., surface electrodes from simultaneous EEG/fMRI-experiments or subdural electrodes in brain extracted MRI recordings from epilepsy-patients.
PyLocator lets you intuitively put marks on such surfaces:
- Reconstruct an iso-surface (see below)
- Find your target by navigating in the surface rendering window
- Hover the mouse cursor over the target
- Hit the key i on the keyboard
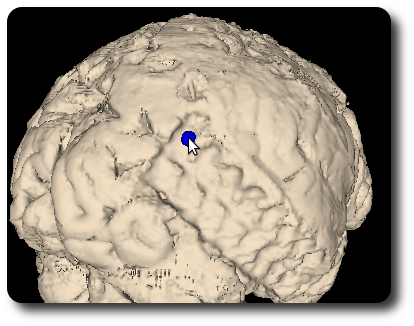
PyLocator tries to find the first point of the iso-surface that is below your mouse cursor and insert a marker here. If you have more than one is-surface rendered you must select on which surface you want to insert your marker in the settings of list of surfaces.
How can I reconstruct iso-surfaces?
Looking at slices of tomgraphic scans is nice and helpful - slices is actually what tomography is all about. But this isn’t all one can do with such recordings, sometimes we just cannot grasp all the information contained.
Calculating and rendering iso-surfaces can sometimes help here. is-surfaces are the 3d analogon of contour lines, connecting neighboring points of equal intensity.
Rendering such surfaces with PyLocator is a one-click process: Just click the “Add” button on the toolbar of the surfaces list. PyLocator tries to estimate a good choice for a threshold of the surface, i.e., the value for which the iso surface is calculated.
If the result is not as you expected (which is not really unlikely...), you can adjust the settings of the iso surface. Click on the list entry, and the options appear.
- Threshold: Intensity value for which the iso surface is calculated. The minimum of the slider is the minimal value of your image, maximum accordingly
- Opacity: Opacity is like “1-transparency”. Reduce the opacity if you want to see other parts of the rendered scene that would otherwise be hidden, e.g., other surfaces, markers, ROIs
- Color: You can choose a color for the surface. We have some predefined colors in a dropdown-list. If none of these fits your needs (or you just want to be creative), choose “custom...” from the list, and you can choose from the whole spectrum of RGB space
Below these, there is an initially closed section to control the VTK pipeline. Here you can choose whether and how to use the Connect Filter and the Decimate Filter. Just play around a little bit to see how these settings influence the result.
The Decimate Filter is disabled as default, but it might be useful to reduce the complexity of the surface in order to increase the performance on older computers.
Note
If you wonder what the “Render” button is good for, you probably can forget it. In older versions, there used to be situations where changes in the settings didn’t directly get applied to the rendered scene. As of version 1.0 of PyLocator, these situations should no more exist, but if you think you have come in such a situation, you can force a redraw using the “Render”-Button
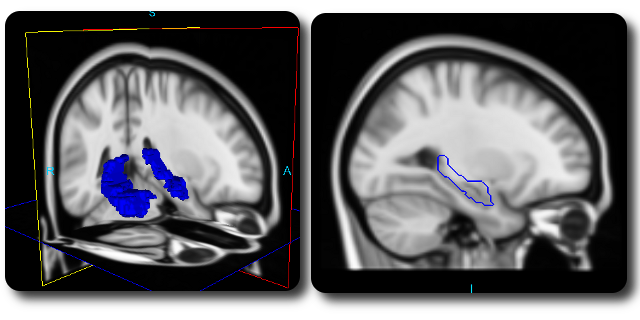
How can I render regions-of-interest?
Navigating through a brain can be really complex, and one might quickly loose orientation. In such situations, it can really be helpful to have some “landmarks”. Here, regions-of-interest (ROIs) come into play.
ROIs can be loaded as additional, binary Nifti-files: they contain 1 for “inside the ROI” and 0 for “outside”. An example for a ROI is available here: hippocampus.nii.gz [1]
To add a ROI to PyLocator, switch to the list of ROIs and click on the “Add”-Button. A file selection dialog lets you choose the Nifti file. After the dialog hase been closed, the ROI is rendered immediately
ROIs are shown in all visualization widgets: as iso surfaces in three 3d widgets and as contour lines in the slice widgets.
| [1] | This file in compressed Nifti format only has approximately 10 kB, compared to >6MB for the uncompressed file. For files containing only zeros and ones, the effect of GZip is really impressive |